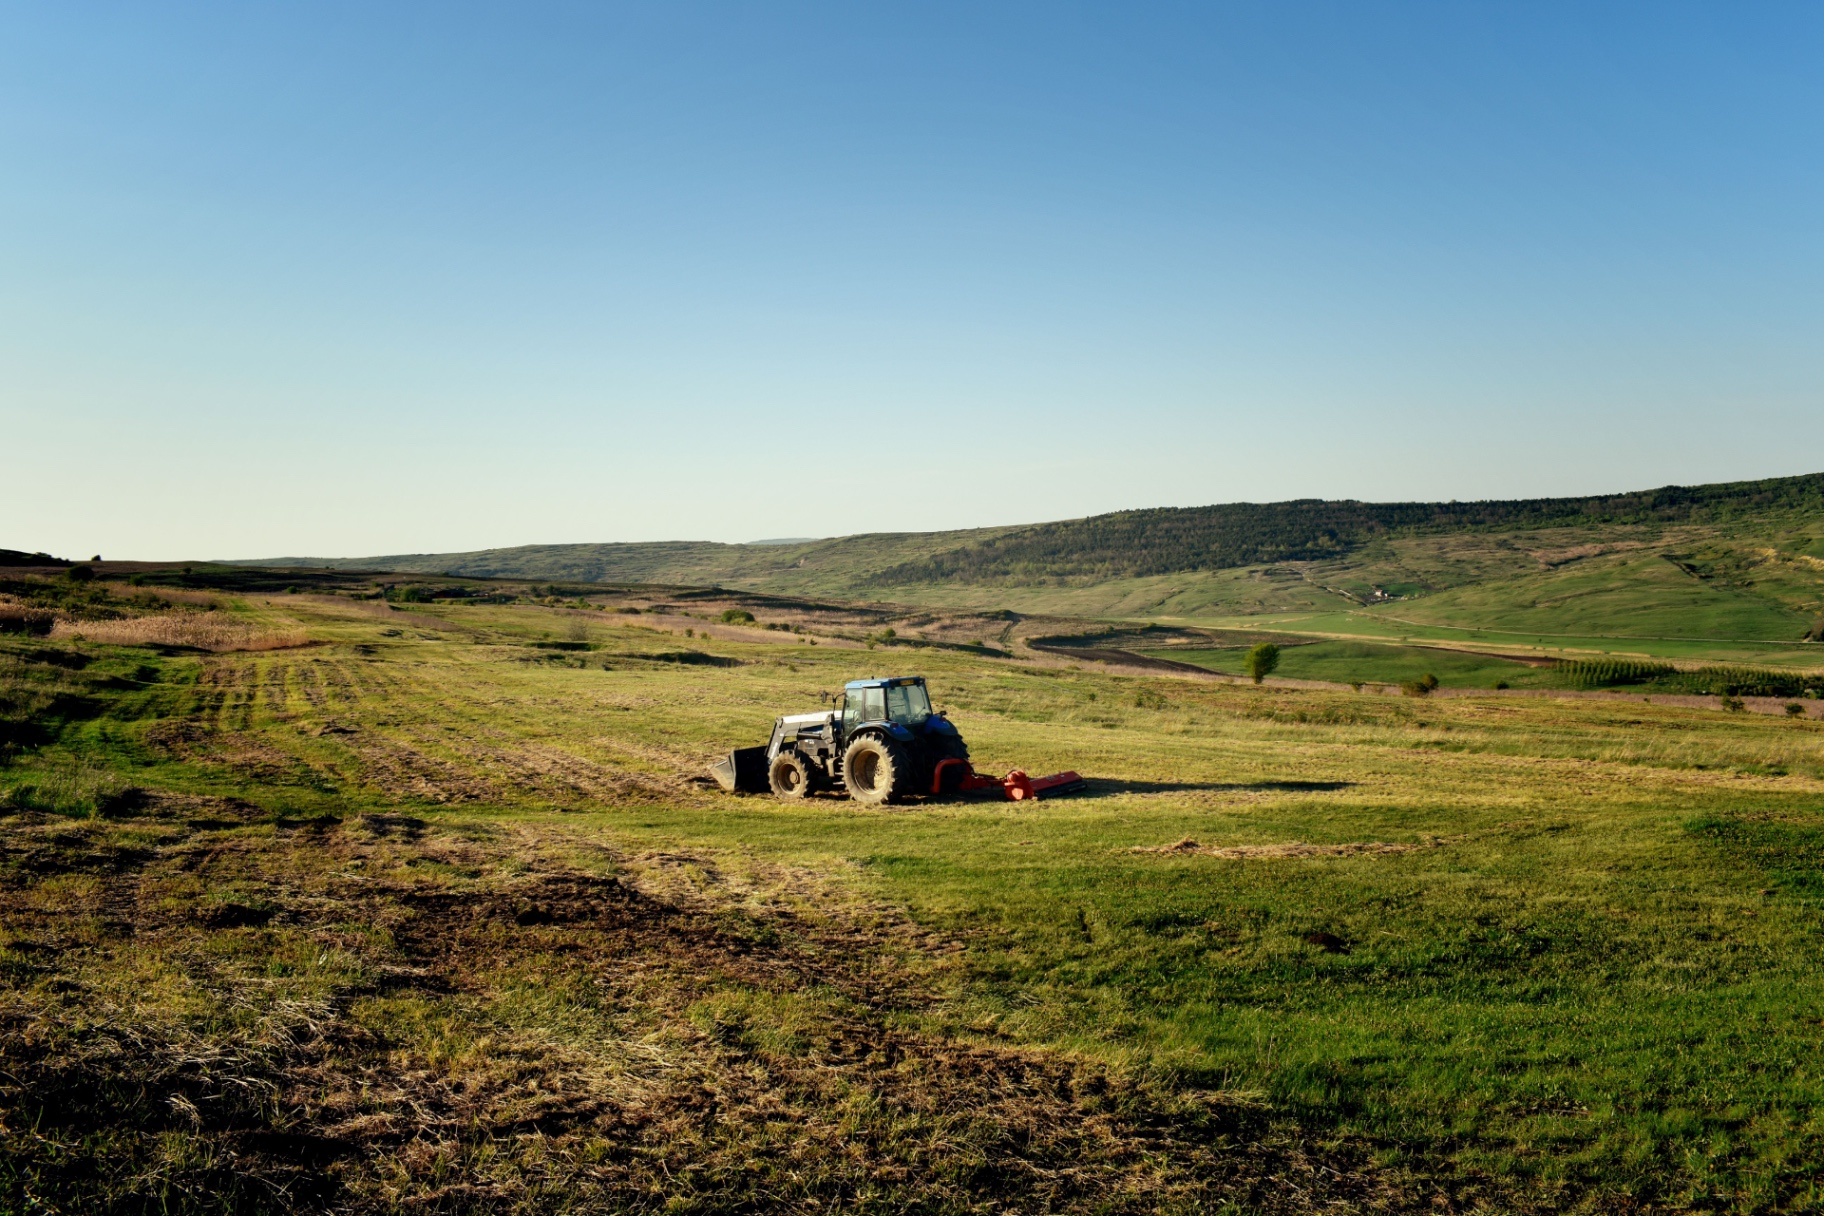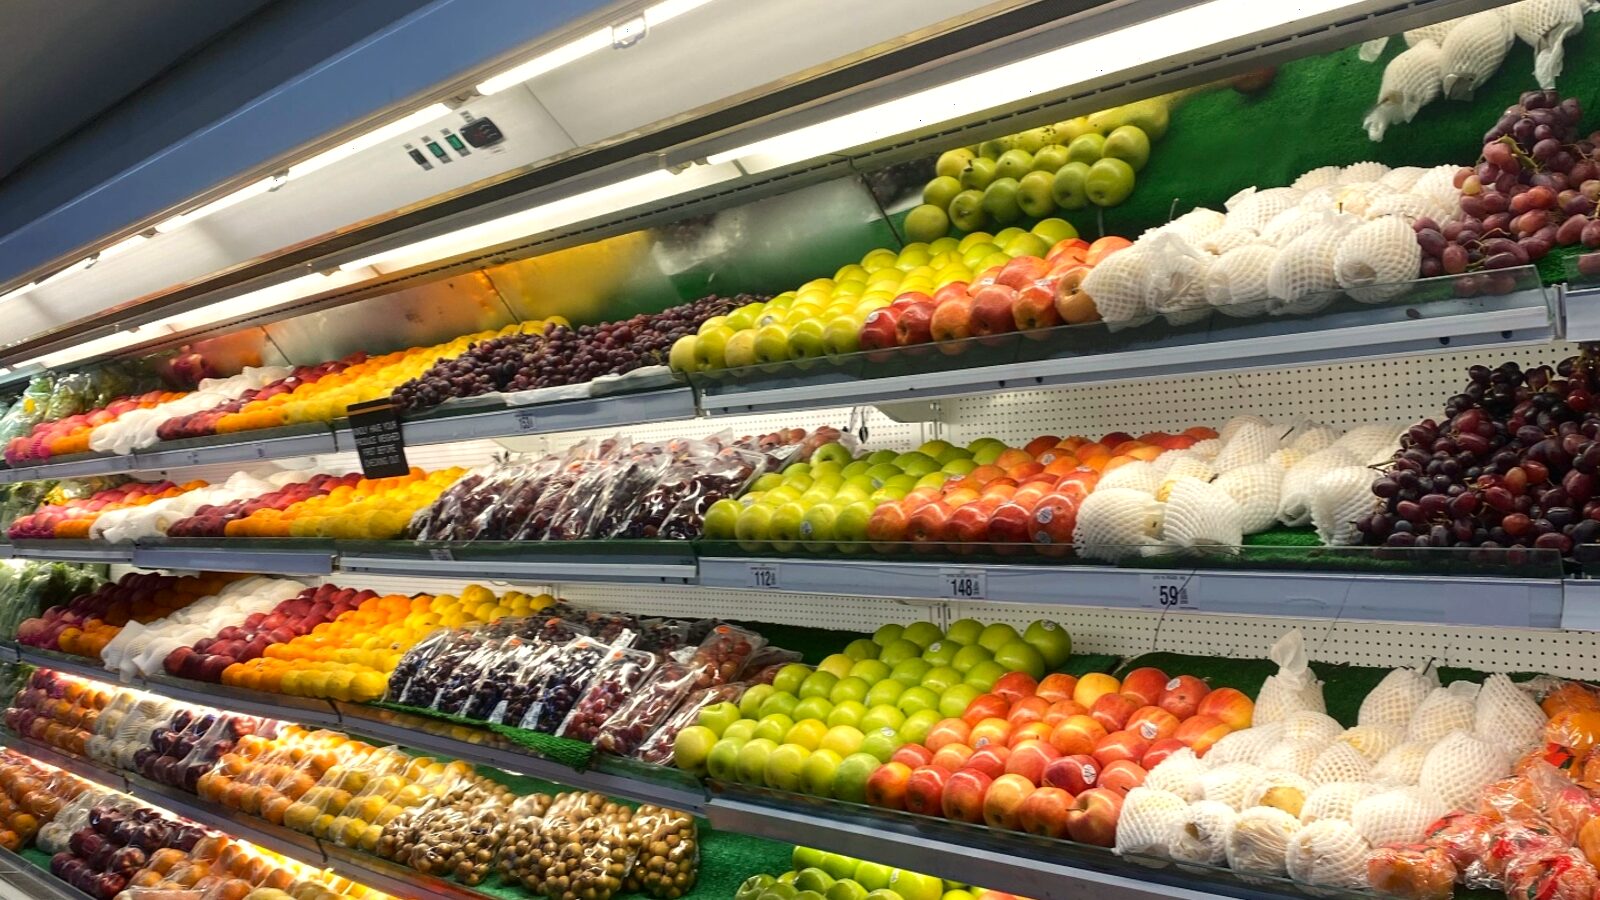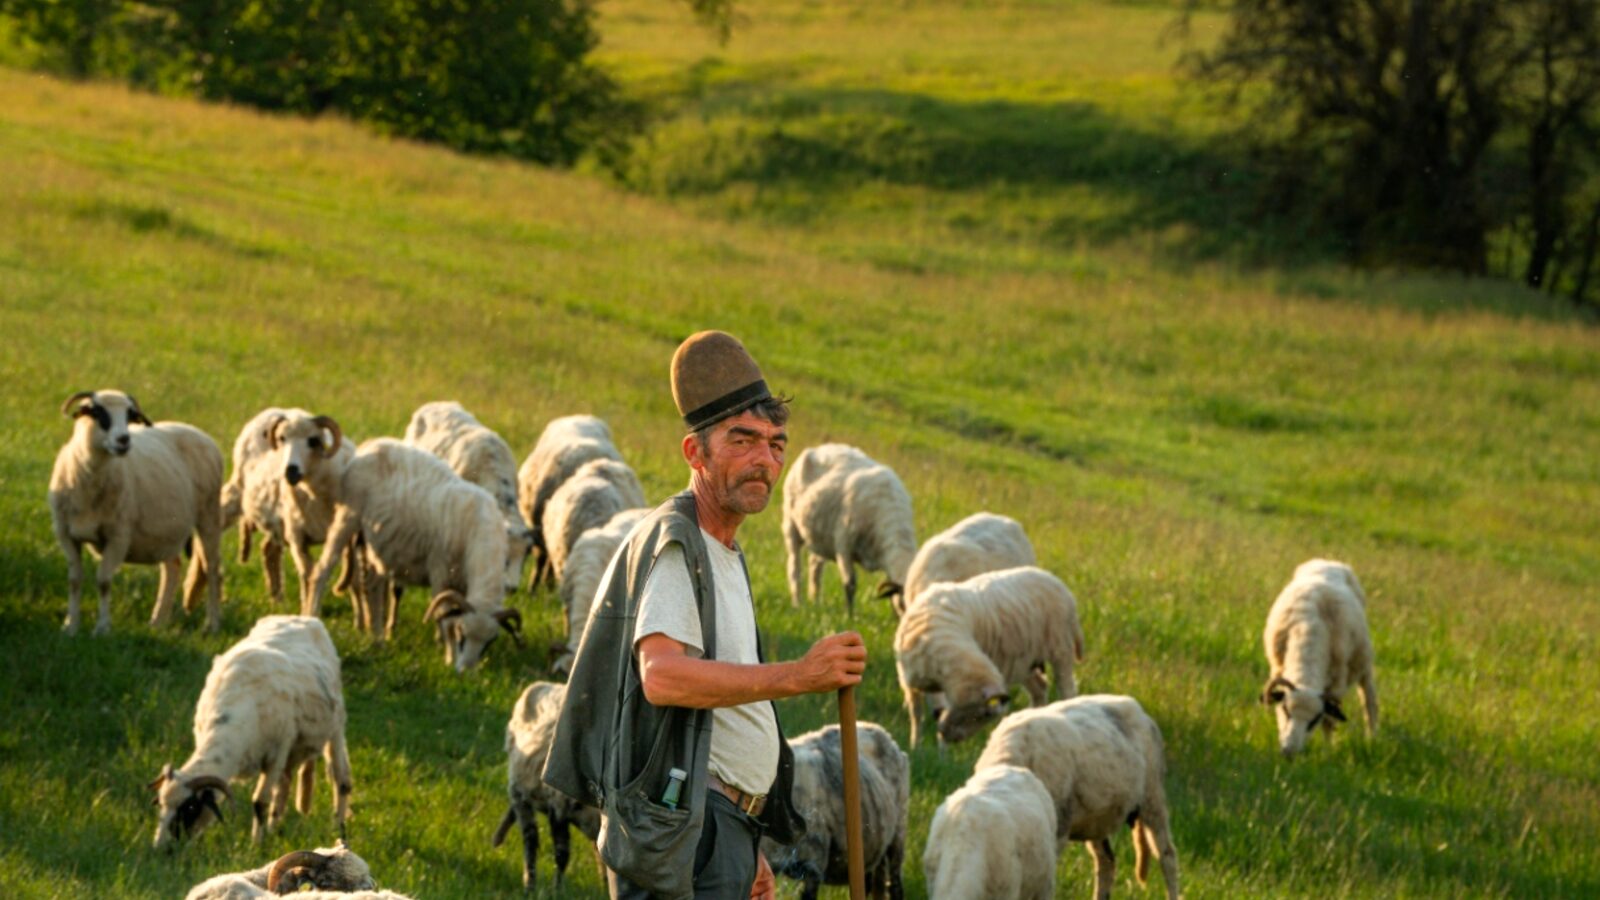
Almost 35 years after 1989, Romanian agriculture looks like two countries inside one. On export statistics, Romania is an agricultural superpower: the EU's 4th-largest wheat exporter, 2nd-largest for maize, 3rd-largest for sunflower. On household consumption statistics, we are an import-dependent country for exactly the things we eat daily: tomatoes, peppers, apples, potatoes, onions, dill.
This paradox is no statistical anomaly. It is the result of political, market and infrastructure decisions taken over the last three decades. And, more importantly, it is reversible. But to see how, you first have to see its anatomy in detail.
The balance sheet nobody shows
Eurostat Comext data, aggregated by INS, gives the exact picture of Romania's 2023 agri-food trade balance.
| Category | Exports | Imports | Net |
|---|---|---|---|
| Cereals | 5.2 | 1.4 | +3.8 |
| Oilseeds (sunflower, rape) | 2.9 | 0.8 | +2.1 |
| Live animals | 0.7 | 0.3 | +0.4 |
| Milk & dairy | 0.4 | 1.1 | −0.7 |
| Processed meat | 0.5 | 1.4 | −0.9 |
| Fresh vegetables | 0.2 | 1.3 | −1.1 |
| Fresh fruit | 0.3 | 1.3 | −1.0 |
| Total agri-food | 12.4 | 11.9 | +0.5 |
The total surplus is misleadingly small: €0.5 billion. But more important than the total is its composition. We export raw commodities (wheat, maize, seeds) and import nearly everything that arrives on the table processed or ready to eat. We trade like an agricultural colony of the West: we export cheap calories, we import added value.
Breakdown by key product
For the fruit and vegetables eaten daily, the situation is even more dramatic than the aggregate shows.
| Product | National consumption (kt) | Domestic production | Imports |
|---|---|---|---|
| Tomatoes | 780 | 234 (30%) | 546 (70%) |
| Peppers | 320 | 58 (18%) | 262 (82%) |
| Cucumbers | 180 | 65 (36%) | 115 (64%) |
| Potatoes | 1,890 | 1,380 (73%) | 510 (27%) |
| Onions | 395 | 215 (54%) | 180 (46%) |
| Apples | 560 | 302 (54%) | 258 (46%) |
| Citrus | 420 | 0 (0%) | 420 (100%) |
| Dill / parsley | 55 | 19 (35%) | 36 (65%) |
Read the last column slowly. Romania imports 70% of the tomatoes it eats, 82% of the peppers, 64% of the cucumbers. Only on potatoes do we still have majority domestic production, and even there a quarter is imported. The country with the best pedoclimatic conditions for horticulture in all of South-East Europe buys peppers from Spain.
How we got here
Three parallel processes explain the current situation.
First: CAP subsidies systematically favoured large crops. Under the Single Area Payment, every hectare of wheat or maize gets the same subsidy as a hectare of tomatoes, but producing a hectare of tomatoes requires 30–50 times more labour and capital. The system rewarded scale, not added value.
Second: the major retail chains that entered Romania post-2000 demanded steady volumes, uniform quality and standardised packaging. None of Romania's small farms could supply such volumes alone. Retailers thus shifted sourcing to exports (Netherlands, Spain, Poland) where cooperative infrastructure enabled supply aggregation.
Third: vegetable storage, packing and processing infrastructure, inherited from former canning factories and warehouses, was dismantled in the 1990s and 2000s without replacement. Today Romania has 0.3 hectares of modern greenhouse per 1,000 inhabitants, vs. 1.1 ha in Poland and 4.8 ha in the Netherlands.
What was lost, in hectares
In 1990 Romania had around 280,000 hectares of vegetables. In 2022 the area was around 120,000 ha, a 57% drop. In the same period, wheat area grew by 18% and sunflower area tripled. The country actively specialised in large, automated, exportable crops, at the expense of horticulture that produces daily food.
Comparison with Poland: what's possible
Poland is a relevant benchmark because it started from a similar post-1989 structure. Today Poland is the world's 5th-largest apple exporter, the EU's 3rd-largest potato exporter, self-sufficient in root vegetables and a net vegetable exporter to Germany and the Czech Republic. The difference is not the soil, it's the organisation. Poland invested consistently in agricultural cooperatives, regional processing infrastructure, and young-farmer installation programmes.
| Indicator | Romania | Poland |
|---|---|---|
| Modern greenhouse area (ha) | 5,800 | 42,300 |
| Vegetable production (kt) | 2,450 | 5,180 |
| Apple production (kt) | 302 | 4,450 |
| Active cooperatives (k) | 0.1 | 1.8 |
| Fruit + veg exports (€B) | 0.5 | 4.2 |
Poland, with smaller agricultural area than Romania, exports 8 times more fruit and vegetables. Its number of active cooperatives is 18 times higher. This is no coincidence. It is the product of a consistent political decision sustained for two decades.
How the trend reverses
Rebuilding local horticulture does not require huge farms or impressive investments in a few mega-projects. It requires a predictable market for small producers, exactly what the classical long chain cannot offer.
- Aggregated online demand: when 5,000 buyers pre-order 200 g of dill for the weekend, the farmer can plant with predictability.
- Consolidated logistics: one collection route serves 12–15 small farms within a 60 km radius.
- No imposed cosmetic standards: 'ugly' produce sells at a discount instead of being thrown away.
- Payment in 24 hours, not 60–90 days: farmers no longer need expensive credit to fund inputs.
- Direct visibility: small farms build a brand and recurring customers.
Why it matters: security, balance, identity
Massive imports of staple products are a strategic vulnerability, made visible in 2020–2022 when global chains seized up. It is an economic problem, every billion euros of imports is a billion that does not stay in Romanian rural communities. And, frankly, it is a cultural problem: a country that no longer produces what it eats loses something hard to recover.
Methodology note
Trade data comes from Eurostat Comext (the EU's official external trade database), aggregated by INS for the Romanian market. Domestic production by category is from annual INS Vegetable Production reports. Import share of domestic consumption is calculated as net imports over apparent consumption (production + imports − exports). Poland comparisons use Eurostat Farm Structure Survey 2020 and the Polish Investment & Trade Agency 2023 report.